Maps
Overview
A map in NovaStar 5 is a background image overlain by a group of map points that specify data values to be displayed. Each map has a number and a unique name that should help describe the combination of background image and point display for that map. The same background image may be used beneath the display of many different data sets.
NovaStar 5 can display map background images saved in the following formats:
- Joint Photographic Experts Group Format (.jpeg and .jpg)
- Graphics Interchange Format (.gif)
- Portable Network Graphics Format (.png)
An alternative to Administrator maps is the NovaStar 5 Operator software, which provides interactive maps that can be zoomed and scrolled.
Map List
Clicking on the Map Data menu will cause the Data Request and Map List menu choices appear. Click Map List to display the Map List page. For a new NovaStar 5 system, no maps will appear on the Map List page. Click the Add button at the upper right-hand corner of the Map List table to define a new map using the Map Add page. See the Map Add section. A new map can be created based on an existing template map using the Map Copy page. See the Map Copy section.

Map List (see also the full-size image)
The Map List table shows all of the maps that have been defined for the system and can show map details including the map Table row number, Number, Name, Origin latitude, Origin longitude, X Scale, Y Scale and Image path. Clicking on any of the column heading buttons will reorder the maps in the Map List, numerically or alphabetically, by that detail. The Choose details... button allows specifying what information is displayed by the Map List page using the Map List Details page, see the Map List Details section.
Click on the Edit button on any map's row in the Map List table to view or edit the defining attributes of that map on the Map Edit page, described in the Map Edit section.
Map List Details
The check boxes on Map List Details page control the items, organization, sort order, and limit the records displayed on the associated List page.

Map List Details (see also the full-size image)
Select the details to display
- Check the box to the left of a detail to display. Details are displayed in the order shown.
- Check the Order by box for the detail to sort first. Check Reverse for a descending sort.
- Check the Then by box for the detail to sort second. Check Reverse for a descending sort.
- Check the second Then by box for the detail to sort third. Check Reverse for a descending sort.
| Button | Action |
|---|---|
| Move Up | Move the selected detail up one row. |
| Move Down | Move the selected detail down one row. |
| Select All | Select all details. |
| Reset | Reset to default details. |
| OK | Return to previous page with new details selected. |
| Cancel | Return to previous page with no changes. |
Select the limits for the display
| Data Label | Description |
|---|---|
| User | Limit display to maps assigned to the user(s). Click User: button to change User Pick Details and order.  Reset pick list to single select. Reset pick list to single select.  Decrease pick list length. Decrease pick list length.  Increase pick list length. Increase pick list length.  Expand pick list to multiple select. Expand pick list to multiple select.  Collapse pick list to single select. Collapse pick list to single select. |
| Scope | Limit display to maps with scope: all, public, private. |
| User Group | Limit display to maps assigned to the user group(s). Click User Group: button to change User Group Pick Details and order. |
Map Pick Details
The check boxes on Map Pick Details page control the items, organization, sort order, and limit the records displayed on the pick list.

Map Pick Details (see also the full-size image)
Select the details to display
- Check the box to the left of a detail to display. Details are displayed in the order shown.
- Check the Order by box for the detail to sort first. Check Reverse for a descending sort.
- Check the Then by box for the detail to sort second. Check Reverse for a descending sort.
- Check the second Then by box for the detail to sort third. Check Reverse for a descending sort.
| Button | Action |
|---|---|
| Move Up | Move the selected detail up one row. |
| Move Down | Move the selected detail down one row. |
| Select All | Select all details. |
| Reset | Reset to default details. |
| OK | Return to previous page with new details selected. |
| Cancel | Return to previous page with no changes. |
Select the limits for the display
| Data Label | Description |
|---|---|
| User | Limit display to maps assigned to the user(s). Click User: button to change User Pick Details and order. Reset pick list to single select. Decrease pick list length. Increase pick list length. Expand pick list to multiple select. Collapse pick list to single select. |
| Scope | Limit display to maps with scope: all, public, private. |
| User Group | Limit display to maps assigned to the user group(s). Click User Group: button to change User Group Pick Details and order. |
Map Add
The Map Add page allows users to create a new map by entering, at a minimum, a unique map Number and Name. All other map parameters are described in the Map Edit page section below. Click the Apply button to save the map to the database and convert display the Map Edit page. The OK button will also save the map then return to the Map List page.

Map Add (see also the full-size image)
Map Edit
Clicking on the Edit button associated with any map defined in the Map List table or clicking Apply from the Map Add or Map Copy pages to create a new map displays the Map Edit page. The map parameters that are edited or input using the Map Edit page are grouped under Identification, Location, Options, Background, Annotation list and Point list headings.

Map Edit (see also the full-size image)
Identification
Map identification is used to organize and describe maps in the system and provide information for map pick lists.
| Data Label | Description |
|---|---|
| Table index | Field cannot be modified; it is assigned automatically when a record is added. |
| Number | Map number must be unique for each map. Map numbering does not have to be sequential. Click on the Number: button to assign the next available map number. |
| Description | This descriptive field does not display on map data display pages. Use it to describe the map functionality. Max: 1000 characters. |
Owner
| Data Label | Description |
|---|---|
| User | Select the map owner from the user list. Click User: button change User Pick Details and order, see the User Pick Details section. Click Reset to assign your login name. |
| Scope | Select map access: Public: Everyone can display this map. Private: Only owner, group supervisor, or administrator can display this map. |
User groups
The User groups table shows the user groups currently assigned to the map.
-
Clicking on any of the column heading buttons will reorder the user groups in the User groups List, numerically or alphabetically, by that detail.
-
Click Details: button to change the User Group List details and display order, see the User Group List Details section.
-
Click Assign/Remove groups button to open User Group Assignment window, see the User Group Assignment section. Changes made to user group assignments will update this page when the assignment window is closed.
-
Click the List button to show all user groups, see the User Group List section.
-
Click Add button to add a user group, see the User Group Add section.
-
Click Edit button to edit the user group, see User Group Edit section.
Location
The Location parameters allow NovaStar 5 to correctly display map point data, based on the latitude and longitude provided during station configuration, on the background image, by locating and scaling the background image.

Location (see also the full-size image)
Latitude (positive in the northern hemisphere, negative in the southern) and Longitude (can be either positive or negative in the western hemisphere, but negative is recommended to be compatible with geographic information system software) of the map origin (the upper left hand corner of the map) are entered. The sign convention used for longitude values must be consistent with those entered for stations in order for data to appear on maps. Latitude and longitude can be displayed and entered as decimal degrees or in degrees, minutes and seconds. Select the display method for latitude and longitude using the drop-down list. Separate the degrees, minutes or seconds with a colon (:); seconds may have a decimal fraction. The X and Y scale values can be display end entered as Pixels per degree or Degrees per pixel.
Click the Show scale wizard button for help in computing the X and Y scale values. The wizard will allow entering the top and bottom latitude, left and right longitude, and map image height and width. Click the Compute map Bottom/Right button to compute the bottom latitude, right longitude from the top latitude, left longitude, height, width, Y and X scale values. Click the Compute map scale button to compute the X and Y scale values. Click the Close scale wizard button to return to the normal display.
| Data Label | Description |
|---|---|
| Latitude Top | Latitude for the map top border. |
| Bottom | Latitude for the map bottom border. |
| Longitude Left | Longitude for the map left border. |
| Right | Longitude for the map right border. |
| Height | Map background height in pixels. |
| Width: | Map background width in pixels. Click the Read image size button to get the image file height and width. Enter a different image size to force the background image display size for a map data display. |
| Y scale | Vertical scaling factor to position annotations and points on the map data display. |
| X scale | Horizontal scaling factor to position annotations and points on the map data display. |
| The map scale is determined by dividing the dimensions of the map image, in pixels, by the corresponding dimension of the map in decimal degrees. The scale value represents the number of pixels per degree for that map image. The scale can be displayed in pixels per degree or degrees per pixel. Select the display method with the drop-down list. vertical map dimension (height) in pixels Y scale = --------------------------------------------------------------------------------------- Difference in longitude between the map top border and bottom border horizontal map dimension (width) in pixels X scale = --------------------------------------------------------------------------------------- Difference in longitude between the map left border and right border |
Options
Map point readouts and annotations are drawn with the default styles for the NovaStar5 server.
Select a custom map style from Map style list.
The style files are Cascading Style Sheets and are stored in the folder: /tomcat/local/styles.
Click the View button to display the style file on the browser.
Click Upload button to add a style sheet file to the server.
Click Remove button to remove a style sheet file from the server. Click OK to acknowledge the file removal.

Options Style Default (see also the full-size image)
To create a new style sheet:
-
Select the default style sheet and click the View button.

View Style File (see also the full-size image)
-
Using the browser File menu select Save As or Save Page As to write the default map style sheet (map.css) to a folder on the workstation.
- Use a text editor to modify the styles in the local file.
- Return to the Map Edit page.
-
Click the Upload button to the right of the Map style to open the Upload file window.

Upload Style File (see also the full-size image)
-
Select the modified local file.

Select Style File (see also the full-size image)
-
Click the Upload button on the Upload file select window.

Uploaded Style File (see also the full-size image)
-
After the upload is successful close the window.
Upload File Success (see also the full-size image)
-
The uploaded file is shown in the select list.

Options with Selected File (see also the full-size image)
Background
Select the map background image file name in the Image select box. Image file names are read from the folder: /tomcat/local/images.
Choose the Other... option at the end of the image select list to enter the full address of an image stored on an external server, for example: http://myserver/images/myimage.png.
Click View button to display the image file on the browser.
Click Upload button to add a map background image to the server.
Click Remove button to remove a map background image from the server. Click OK to acknowledge the file removal.

Background File Default (see also the full-size image)
To upload a map background image:
-
Click the Upload button to the right of the image pick list.

Upload Background File (see also the full-size image)
-
Select the new map image file.

Select Background File (see also the full-size image)
-
Click the Upload button on the Upload file select window.

Uploaded Background File (see also the full-size image)
-
After the upload is successful close the window.

Upload Background Success (see also the full-size image)
-
The uploaded file is shown in the select list.!

Background with Selected File (see also the full-size image)
Select the Image class for the map background. The image class list is read from the Map style file. This class can set image properties such as border thickness, type and color. The default image class is mapimage. The mapimage class from the default map style sheet is:
/* Map background image class
position:relative; is required!
 text-decoration:none; is required!
border:0px solid black; Change for a colored border around the map
image. */ div.mapimage {position:relative;}
a.mapimage {text-decoration:none;}
img.mapimage {border:0px solid black;}
For example to draw a 2 pixel width blue border around a map image change the style to:
img.mapimage {border:2px solid blue;}
Map Annotation List
The Annotation List displays the map annotation records assigned to the map being edited. Map annotations are text strings, markers, or image files that are displayed on top of the map background at the pixel position defined in the table columns: Left and Top. If links are assigned to a map annotation, the active link area can be extended to the pixel lengths by the columns: Width and Height. A marker precedes annotation text. Text overwrites an image. When a map is first defined, no map annotation records will be assigned to the map.
Click on the table column headers to resort the table for this column; first ascending, then descending. Click on the Choose details... button to change the details and display order. Click on a table field to edit the text. Click Add to add an new annotation; the annotation list edit panel is opened. Click Edit to edit an existing annotation; the edit panel is opened.

Map Annotation List (see also the full-size image)
| Button | Action |
|---|---|
| Clear all | Clear selection of all rows in this table. |
| Select all | Select all rows in this table. |
| Add | Opens the edit panel where parameters for a new record can be entered. |
| Edit | Open the edit panel for this record. |
| Select | Select row for applied changes from the edit panel; first select, then clear select. |
| Delete | Mark selected rows for deletion; first select, then clear select. |
| Move up | Move the selected rows up one row. |
| Move down | Move the selected rows down one row. |
| Apply | Assign changed field values to this and all other selected rows in the table. Changed fields are highlighted with a blue-green background while unchanged fields have a white background. |
| Close | Close the edit panel without saving changes; a warning will be displayed if changes will be lost by this action. |
Map Annotation List Details
The check boxes on Map Annotation List Details page control the items, organization, sort order, and limit the records displayed on the associated List page.

Map Annotation List Details (see also the full-size image)
Select the details to display
- Check the box to the left of a detail to display. Details are displayed in the order shown.
- Check the Order by box for the detail to sort first. Check Reverse for a descending sort.
- Check the Then by box for the detail to sort second. Check Reverse for a descending sort.
- Check the second Then by box for the detail to sort third. Check Reverse for a descending sort.
| Button | Action |
|---|---|
| Move Up | Move the selected detail up one row. |
| Move Down | Move the selected detail down one row. |
| Select All | Select all details. |
| Reset | Reset to default details. |
| OK | Return to previous page with new details selected. |
| Cancel | Return to previous page with no changes. |
Map Annotation list parameters

Map Annotation Edit Panel (see also the full-size image)
| Data Label | Description |
|---|---|
| Left | Leftmost position of the annotation in pixels right of the left border. |
| Top | Topmost position of the annotation in pixels below of the top border. |
| Width | Optional width to extend the active link area in pixels for the annotation. |
| Height | Optional height to extend the active link area in pixels for the annotation. |
| Text | Text string for the annotation. |
| Text class | Select a class from the map style sheet to define the text display style. The default class is maptext. This class displays the text annotation in a black, 10 point, bold font with no border./* Map text class - default for map text annotations.position:absolute; is required! background-color:transparent; is recommended */div.maptext {position:absolute;background-color:white;}a.maptext {color:black;font-size:10pt;font-weight:bold;} |
| Parameter | Append selected display parameter key words to the text. These key words are replaced by the map display request parameters: Map number: _MAPNUMBER Map name: _MAPNAME Ending time: _ENDINGTIME Display interval: _DISPLAYINTERVAL Data analysis: _DATAANALYSIS |
| Marker | Select a marker to preceed the text in the annotation or none for no marker. A marker is a graphical image file stored in the NovaStar 5 or local marker folder ( /tomcat/local/markers). The annotation text is placed immediately to the right of the marker. Click the View button to display the selected marker on the browser. Right click this button to view the marker in another window or tab. Click the Upload button to upload a new marker image to the local marker folder. Click the Remove button to delete a marker from the local marker folder. OK must be clicked to acknowledge the file removal. |
| Marker Class | Select a class from the map style sheet to define the marker display style. The default style is no border and a transparent background. T0 upload a marker: 1. Click the Upload button to the right of the marker pick list.  Upload Marker File (see also the full-size image) 2. Select the new map image file.  Select Marker File (see also the full-size image) 3. Click the Upload button on the Upload file select window.  Uploaded Marker File (see also the full-size image) 4. After the upload is successful close the window.  Upload Marker Success (see also the full-size image) 5. The uploaded file is shown in the select list.  Marker with Selected File (see also the full-size image) |
| Image | Select an image file name to display on the map or none for no image. An image is a graphical image file stored in the NovaStar 5 or local image folder (/tomcat/local/images). The annotation text is placed on top of the image. Click the View button to display the selected image on the browser. Right click this button to view the image in another window or tab. Click the Upload button to upload a new image file to the local image folder. Click the Remove button to delete an image file from the local image folder. OK must be clicked to acknowledge the file removal. |
| Image Class | Select a class from the map style sheet to define the image display style. The default style is no border and a transparent background. To upload an image: 1. Click the Upload button to the right of the image pick list.  Upload Image File (see also the full-size image) 2. Select the new map image file.  Select Image File (see also the full-size image) 3. Click the Upload button on the Upload file select window. Uploaded Image File (see also the full-size image) 4. After the upload is successful close the window.  Upload Image Success (see also the full-size image) 5. The uploaded file is shown in the select list.  Image with Selected File (see also the full-size image) |
| Link | Enter an optional hyperlink for this annotation. NovaStar 5 page links can be entered with no hostname path. For example to display map number 4 from this hyperlink use the link name: mapData.do?mapNumid=4. Otherwise enter the URL of the hyperlink, for example: http://www.mylink.com/thislink. |
| Link help | Enter the tool tip to display when the mouse hovers over the map annotation text, image, or marker. |
Map Point List
The Point List displays the map point records assigned to the map being edited. Map points define the point data analysis and data readout display styles to display on top of the map background. A map point is displayed on the map background as site marker followed by a text data readout in a box to the right of the marker. The site marker is located on the map using the point's station latitude and longitude. The text data readout is positioned relative to the site marker by an X and Y Offset. Hyperlinks are assigned to the map point markers and text data readouts. The default hyperlink displays the data edit page for the point and map request time period.
Click on the table column headers to resort the table for this column; first ascending, then descending. Click on the Choose details... button to change the details and display order. Click on a table field to edit the text. Click Add to add an new point; the point list add panel is opened. Click Edit to edit an existing point; the edit panel is opened.

Map Point List (see also the full-size image)
| Button | Action |
|---|---|
| Clear all | Clear selection of all rows in this table. |
| Select all | Select all rows in this table. |
| Add | Opens the edit panel where parameters for a new record can be entered. |
| Edit | Open the edit panel for this record. |
| Select | Select row for applied changes from the edit panel; first select, then clear select. |
| Delete | Mark selected rows for deletion; first select, then clear select. |
| Move up | Move the selected rows up one row. |
| Move down | Move the selected rows down one row. |
| Apply | Assign changed field values to this and all other selected rows in the table. Changed fields are highlighted with a blue-green background while unchanged fields have a white background. |
| Close | Close the edit panel without saving changes; a warning will be shown if changes will be lost by this action. |
Map Point List Details
The check boxes on Map Point List Details page control the items, organization, sort order, and limit the records displayed on the associated List page.

Map Point List Details (see also the full-size image)
Select the details to display
- Check the box to the left of a detail to display. Details are displayed in the order shown.
- Check the Order by box for the detail to sort first. Check Reverse for a descending sort.
- Check the Then by box for the detail to sort second. Check Reverse for a descending sort.
- Check the second Then by box for the detail to sort third. Check Reverse for a descending sort.
| Button | Action |
|---|---|
| Move Up | Move the selected detail up one row. |
| Move Down | Move the selected detail down one row. |
| Select All | Select all details. |
| Reset | Reset to default details. |
| OK | Return to previous page with new details selected. |
| Cancel | Return to previous page with no changes. |
| Data Label | Description |
|---|---|
| Point | Select points to add to the point list from the pick list. Click button to change Point Pick Details and order, see the Point Pick Details section.
|

Map Point List Add Panel (see also the full-size image)
Click the Apply button to add all selected points to the point list. The point list add panel will change to the point list edit panel for the last point added. Other parameters will then need to be assigned to each point. First click Clear all to de-select all points except the one shown in the edit panel.
Point list parameters

Map Point Edit Panel (see also the full-size image)
| Data Label | Description |
|---|---|
| Point | Select points to add to the point list from the pick list. Click button to change Point Pick Details and order, see the Point Pick Details section. |
| Label | Enter the tool tip label for a mouse hover over the point marker and data readout. By default the point pick list details are used. Click button to fill in the default label for editing from the point pick details. |
| Link | Enter an optional hyperlink for this point. NovaStar 5 page links can be entered with no hostname path. For example to display report group number 4 from this hyperlink use the link name: reportData.do?reportNumid=4. Otherwise enter the URL of the hyperlink, for example: http://www.mylink.com/thislink. |
| Link help | Enter the tool tip for a mouse hover over the right click menu hyperlink for this point. The label field above is shown for a mouse over the point marker and data readout. |
| Analysis | Select the data analysis for the point readout. See the data analysis appendix for a description of the analysis types. Use default analysis will perform the map data request analysis selected. Any other analysis type selected will override the map data request analysis. |
| Analysis Interval | The Storm Rainfall and Rainfall Intensity data analysis require an analysis interval. See the Data Analysis Appendix for a description of the analysis interval use for these analysis types. Click the button to alternate between interval selection from a pick list or from time interval fields. Analysis (see also the full-size image) |
| Data type | Select the type of data displayed: Scaled: Scaled or analysis value Raw: Raw data value Score: Nova score value Rating1-Rating5: Rating value 1 - 5 |
| Display Interval | Select the time interval for the data analysis. The time interval is used to compute the start time for the data analysis from the end time. Click the button to alternate between interval selection from a pick list or from time interval fields. Use Request Interval and Show Data Reports will use the map data request display interval if selected or 1 day by default. |
| Time Offset | Select the time offset from the map data request end time for the data analysis period, default if 0.0 seconds. A positive time offset starts in the future (After), a negative time offset starts in the past (Before). Click the Time Offset: button to select from a list of intervals. The time offset direction is selected from the After/Before list. Click the button again to use the time offset fields. |
| Multiplier | Multiply the data analysis computed value by this constant. |
| Adder | Add this constant to the data analysis computed value. |
| Type | Select the readout type. The only type supported at this time is text. |
| Lower limit | Lower limit for the display of the point readout data. |
| Upper limit | Upper limit for the display of the point readout data. If the lower and upper limits are defined, a point's readout will not be displayed if the data analysis value is below the lower limit or above the upper limit. Leave these fields blank to display all point data analysis values. |
| Marker | Select a marker to mark the point's location on the map, default is the green circle for valid data and red circle for missing data. Select none for no marker. A marker is a graphical image file stored in the NovaStar 5 or local marker folder (/tomcat/local/markers). The data readout text is placed immediately to the right of the marker. Click the View button to display the selected marker on the browser. Right click this button to view the marker in another window or tab. Click the Upload button to upload a new marker image to the local marker folder. See the map annotation marker upload procedure described above. Click the Remove button to delete a marker from the local marker folder. |
| Use score | Select true to change the marker displayed for the data analysis score value. The score value (1-5, 0 for missing) is appended to the marker name. For example if the marker name is rain.png, then a score of 1 will display the marker rain1.png, a score of 2 will display the marker rain2.png, and so on. Missing data will display the marker rain0.png. This feature is false by default. |
| Marker class | Select a class from the map style sheet to define the marker display style. The default style is mapmarker with no border and a transparent background. |
| Use score | Select true to change the marker class displayed for the data analysis score value. The score value (1-5, 0 for missing) is appended to the marker class name. For example if the marker class name is mapmarker then a score of 1 will use the class mapmarker 1, a score of 2 will use the class mapmarker2, and so on. Missing data will use the class mapmarker0. This feature is false by default. |
| Marker missing | Select a marker to mark the point's location on the map when the data is missing, default is the red circle. Select none for no marker on missing data. |
| Marker missing class | Select a class from the map style sheet to define the marker for missing data display style. The default style mapmarker is no border and a transparent background. |
| X Offset | Horizontal offset for the data readout text. |
| Y Offset | Vertical offset for the data readout text. Data is displayed to the right of the site marker on a map. The X Offset and Y Offset allow adjusting where on the map the data will be displayed. If there are two points for the same station displayed on the same map, the data readout text will overlay each other unless the points have different offsets. If the data readout text is too crowded on the map, the offsets can be used to reposition the text. A positive X Offset moves the data display to the right, a negative offset moves the data display to the left. A positive Y Offset moves the data display down, a negative offset moves the data display up. |
| Special case | Maps that have 0 for both top latitude and left longitude and 1 for both x and y scale values use the X and Y offsets as the data readout text position relative to the upper left corner of the map background. |
| Line to text | Select true to draw a line from the marker to the upper left corner of the data readout text. This feature is false by default.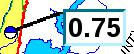 |
| Text Class | Select a class from the map style sheet to define the data readout text display style. The default class is mapdata in the default map style sheet. This class displays the data readout values in a black, 8 point, bold font surrounded by a 1 pixel black solid border.  /* Map readout styles for scores 1-5, 0 for missing data. */a.mapdata,a.mapdata0,a.mapdata1,a.mapdata2,a.mapdata3,a.mapdata4,a.mapdata5 {color:black;font-size:8pt;font-weight: bold; border-color:black;border-width:1px;border-style:solid;height:1;}To change the display style, create a class in the custom map style sheet. In the example below display the data readout values in a black, 20 point, bold font with 2 pixel left and right padding, surrounded by a 3 pixel light-blue inset border.  /* Map rain readout styles for scores 1-5, 0 for missing data.*/ a.maprain,a.maprain0,a.maprain1,a.maprain2,a.maprain3,a.maprain4,a.maprain5{ color:black;font-size:20pt;font-weight:bold; padding-left:2px;padding-right:2px; padding-top:0px;padding-bottom:0px; border-color:#00ccff;border-width:3px;border-style:inset;height:1} |
| Use score | Select true to change the text class for the data analysis score value. The score value (1-5, 0 for missing) is appended to the text class name. For example if the text class name is mapdata, then a score of 1 will use the class mapdata1, a score of 2 will use the class mapdata2, and so on. Missing data will use the class mapdata0. This feature is true by default and is used to change the background color of point text data readouts for the data score.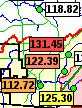 /* Map readout background colors for scores */a.mapdata0,td.mapdata0 {color: #888888;background-color:#ffffff;} a.mapdata,td.mapdata,a.mapdata1,td.mapdata1 {background-color:#ffffff;} /* white */a.mapdata2,td.mapdata2 {background-color:#ffff44;} /* yellow */a.mapdata3,td.mapdata3 {background-color:#ffaa44;} /* orange */a.mapdata4,td.mapdata4 {background-color:#ff8866;} /* pink */a.mapdata5,td.mapdata5 {background-color:#ff4444;} /* red */ |
| Show units | Select true to append the data readout abbreviated units to data value. This feature can be used to indicate the sensor type data when multiple sensors for a station are displayed on the same map. This feature is false by default. |
| Display digits | Set the number of decimal digits to display to the right of the decimal point. Select default to use the number of display digits assigned to the point type. |
| Text missing | Set the missing data string to be displayed. Blank uses the default string "N/A". Do not use a blank string to hide missing data. Instead use the Hide missing feature below. |
| Text missing class | Select a class from the map style sheet to define the missing data readout text display style. The default class is mapdata in the default map style sheet. This class displays the data readout values in a black, 8 point, bold font surrounded by a 1 pixel black solid border. |
| Hide missing | Select true to prevent the display of missing data. This feature is false by default. |
Map Copy
The Map Edit page allows a user to add a map with all of the same parameters, annotations and points as an existing defined map using the Copy button. Press the Copy button on the Map Edit page to display the Map Copy page. Copying an existing map is most convenient when the new map will share many parameters with the existing map that is used as a copy template. Once a unique map Number and Name have been assigned to the copied map, clicking the Apply button will create the copied map and access the Map Edit page, described in the Map Edit section.
Map Delete
To delete a map from the Map List, click Edit on that map's row in the table and then click Delete from the Map Edit screen to view the Map Delete page. The Map Delete page prompts to click the Delete button again to confirm that the map should be deleted. When a map is deleted, NovaStar 5 will delete all map annotations and points assigned to the map the return to the Map List page. Click Back to cancel the delete request.